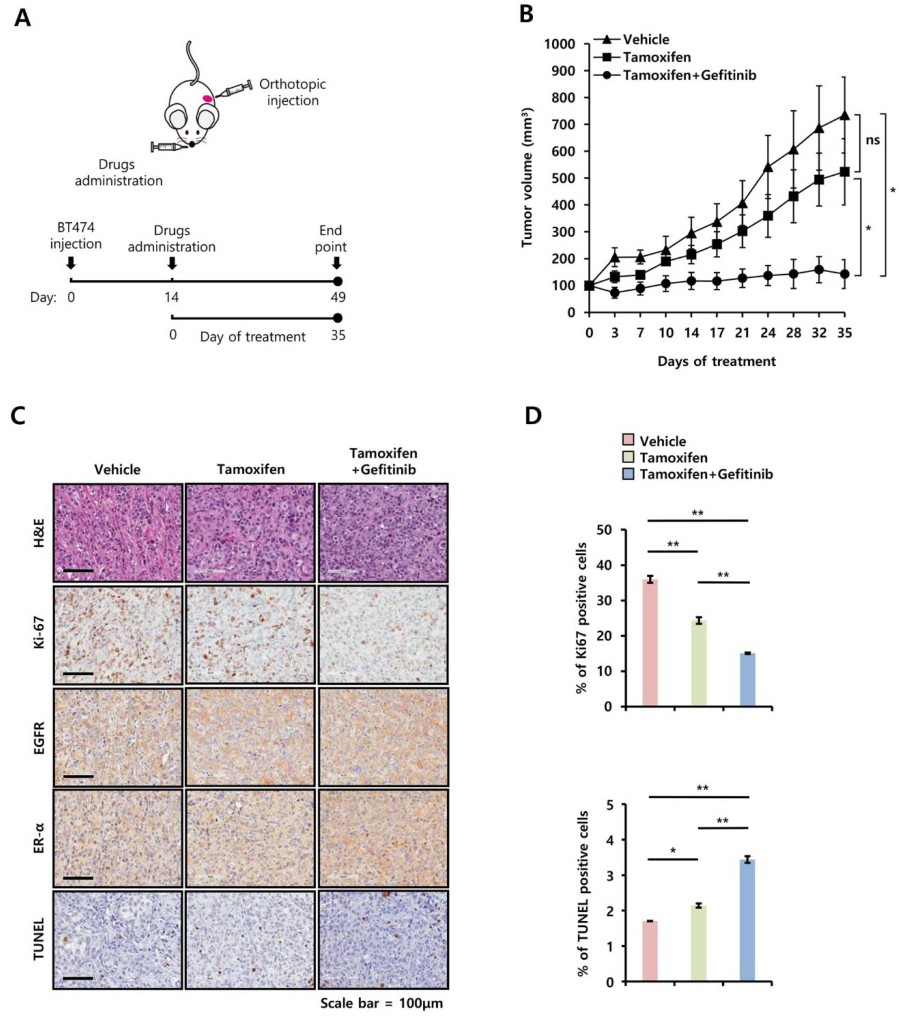
Fig. 7. Pharmacological effect of tamoxifen and/or gefitinib in orthotopic xenograft models. (A) Experimental schematic of drug injection into the xenograft model. (B) Tumor sizes for each group (n = 4) were analyzed for 35 days. Values are mean ± standard errors. * P<0.05 vs. vehicle. (C) After 35 days, tumor tissues were collected from Veh-, tamoxifen- and/or gefitinib-treated groups and stained with H&E or for Ki67, EGFR, ER-a and TUNEL. (D) Immunohistochemical scores. Quantitative data for Ki-67 and TUNEL positive cells were obtained by counting four fields. Values are mean ± SEM. * P<0.05, ** P<0.01 vs. (-) control. Scale bar = 100 mm.